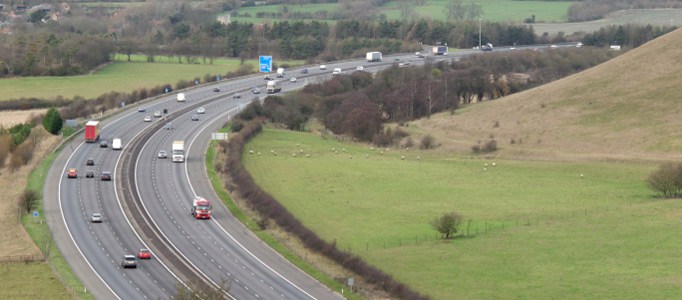
Here at Creditplus we love data, and love to use it to find trends. Using our own data and various surveys, we conducted a study into the distances that our customers travel to work and whether the area that they lived had a vital part to play in that. Factors such as unemployment levels and the price of housing were taken into consideration when reporting on our findings.
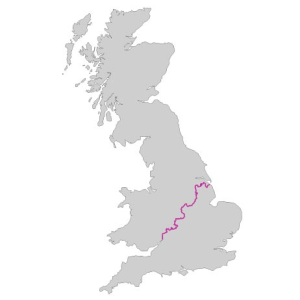
From analysing our data we were able to see that people that live in the Northern part of the UK generally have further to commute to work than those who live in the South of the UK.
The average road miles driven for the South: 21.57
The average road miles driven for the North: 22.03
The above data was calculated on the miles that people travel on a single journey to work from their home address.
There are now almost 50 unemployment black spots across the country and more than a quarter of these have nobody in work. All but four of these struggling towns and cities are in Northern England, Scotland and Wales (Mirror,2013), could this be the reason why commuting distances for the North are higher than the South?
A recent study conducted by This Is Money looked at the best and worst cities to find a job in the UK. Their research revealed that employment levels in Northern parts of the UK are significantly lower than in the the South. This might explain why we found the average commuting time for the average person living in the North of the country is higher than those in the South. This data was then used in conjunction with ours to help identify any positive or negative correlation between the best and worst cities to find work and the distances people have to travel to work.
Aberdeen was the only city from the North that made it into the top 10, gaining an impressive first place with under 1 jobseeker (0.40) applying for each job vacancy in comparison to Hull which has a massive 51.72 people applying for each vacancy! (This is money, 2013) No wonder Hull was voted the worst city to find a job in! When we looked at the average miles travelled for people living in Aberdeenshire and compared them to other Northern counties, it was clear to see that these people shared a shorter commuting distance. This can be clearly shown in Figure 1.
| Counties | Average Miles Travelled (Single Journey) | Average Miles Travelled (Round Journey) |
|---|---|---|
| Aberdeenshire | 13.73 | 27.46 |
| Lanarkshire | 18.42 | 36.84 |
| Lancashire | 23.36 | 46.72 |
| West Midlands | 34.92 | 69.84 |
| Yorkshire (All) | 28.29 | 56.58 |
| The above results have been calculated on Land Transport |
The West Midlands on the other hand which covers, Shropshire, Herefordshire, Staffordshire, Worcestershire and Warwickshire showed an average single commuting distance of 34.92 miles to work and an all round distance of 69.84 miles. A long way! BUT is this really surprising? With certain parts of Birmingham showing unemployment rates to be greater than 10%, Walsall and Wolverhampton showing unemployment to be anywhere in between 6 and 7.9% and the South East of Wolverhampton showing unemployment levels to be between 8 and 9.9%. (BBC,2013) The total population of the West Midlands region was 5.6 million in mid-2011, 11% of the population of England. (ONS,2013) The West Midlands also has the highest proportion of people with no qualifications. The percentage of the regions population having no qualifications in 2010 was 14.0 per cent compared with 10.7 per cent for the UK as a whole. (ONS,2012) With the population density being so high and the sheer amount of people being out of work the competition to find a job is going to be fierce. Consumers will be forced to commute further to work in order to finance themselves and their families. Behind Aberdeenshire, came Guildford closely followed by Cambridge in third for the best cities to find work in; however as a whole the surrounding areas of London seemed to be doing well against other competing cities. Reading, Oxford, Milton Keynes and Slough all managed to gain a place in the top 10. From this we were then able to identify trends within our own data which showed that people that live in Buckinghamshire, Oxfordshire, Berkshire and Surrey all travel relatively short distances to work, could this have anything to do with unemployment levels not being at a high in these areas therefore as a result consumers do not have to travel long distances to find work? The unemployment rate in the South East stood at 6.1 per cent in the fourth quarter of 2010, lower than the UK rate of 7.9 per cent. (ONS,2009) Below is a map outlining each of the four counties and their average commuting distance to work.
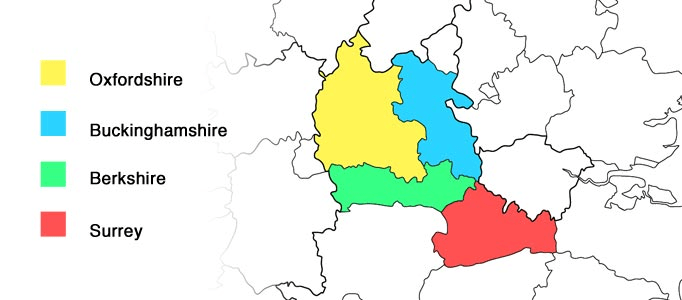
Oxfordshire – 11.42 Buckinghamshire – 9.80 Berkshire – 10.89 Surrey – 13.44
These counties are also looked upon as affluent areas to live; with the average house price across the 4 counties costing you a whooping £431,628! The South East is home to some of the wealthiest households in the UK, attracting highly educated professional individuals and families turning over a good yearly salary. In April 2010, the median gross weekly earnings for full-time employees on adult rates who were resident in the South East was £548, higher than the UK median of £499. (ONS,2009)
If you found this data interesting and would like to obtain a full data set for each of the different counties please feel free to contact Louise Haines at louise.haines@creditplus.co.uk


 Facebook
 Twitter
 Instagram
 LinkedIn
 Youtube